

Oilfield services company Weatherford (NASDAQ:WFRD) beat Wall Street’s revenue expectations in Q3 2026, but sales fell by 7.2% year on year to $1.14 billion. Its non-GAAP profit of $1.88 per share was 48.2% above analysts’ consensus estimates.
Is now the time to buy Weatherford? Find out by accessing our full research report, it’s free.
Weatherford (WFRD) Q3 2026 highlights:
- Revenue: $1.14 billion vs analyst estimates of $1.13 billion (7.2% year-on-year decline, 0.8% beat)
- Adjusted EPS: $1.88 vs analyst estimates of $1.27 (48.2% beat)
- Operating Margin: 13.4%, down from 14.4% in the same quarter last year
- Free Cash Flow Margin: 13.6%, up from 8% in the same quarter last year
- Market Capitalization: $5.69 billion
We also made significant progress on our strategic priorities during the quarter. The closing of the NCS Multistage acquisition strengthens our completions portfolio, broadens our technology capabilities, and positions us to realize meaningful cost and commercial synergies. We further enhanced our capital structure by issuing a notice to redeem the remaining $236 million principal amount of our 2030 Senior Notes, reducing future interest expense. Shareholders approved our proposed redomestication to Delaware, an important step toward a simpler, more efficient corporate structure and improved free cash flow generation. Finally, our Enterprise Resource Planning (“ERP”) transformation remains on track, with our first major application launching very smoothly in the third quarter, enabling greater process standardization, simplification, operational efficiency and scalability across the enterprise.
Company overview
Operating in roughly 75 countries with over 300 facilities worldwide, Weatherford (NASDAQ:WFRD) provides equipment and services for drilling, completing, and maintaining oil and gas wells.
Revenue growth
A company’s long-term performance can give signals about its business quality. Even a bad business, especially in a cyclical industry, can shine for a year or so, but a top-tier one should exhibit resilience through cycles. Over the last five years, Weatherford grew its sales at a sluggish 5.9% compounded annual growth rate. This was below our standard for the energy upstream and integrated energy sector and is a tough starting point for our analysis.
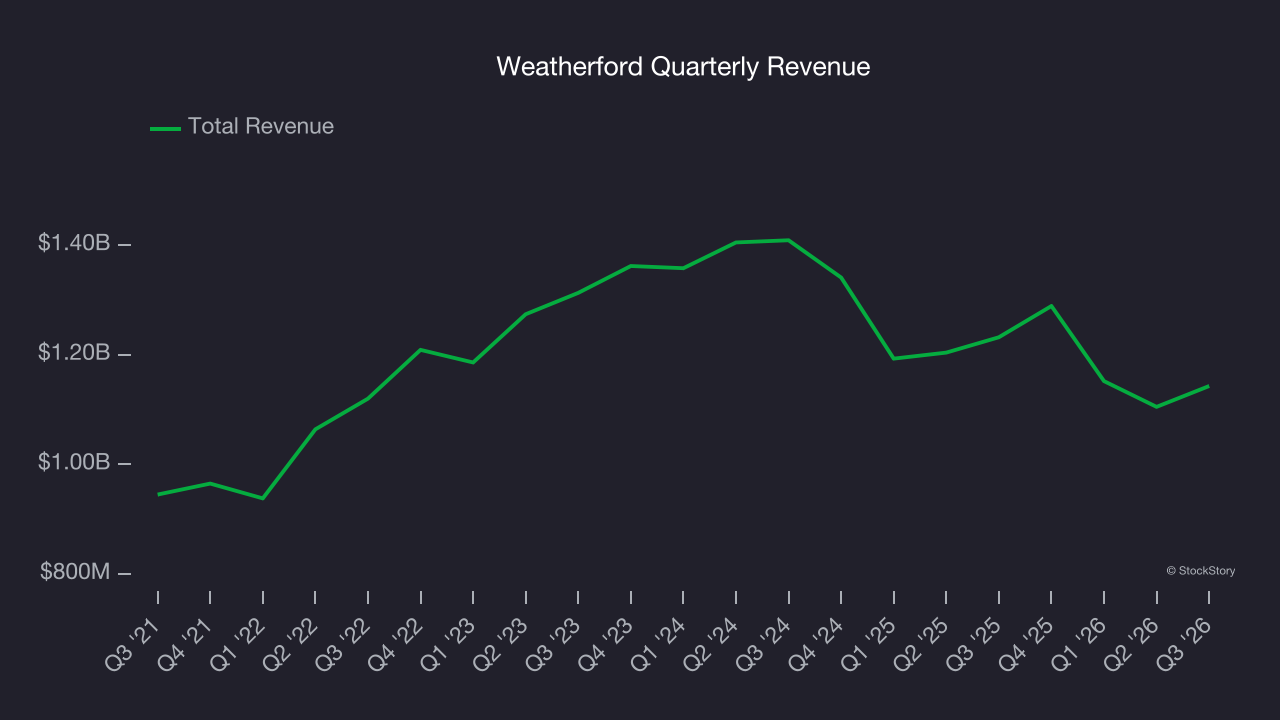
Energy cycles can be long enough that a single five-year period can still reflect one price environment, which is why an additional, decade-long view can help capture through-cycle performance. Weatherford’s performance shows it grew in the past five-year but relinquished its gains over the last ten years, as its revenue fell by 3% annually.
This quarter, Weatherford’s revenue fell by 7.2% year on year to $1.14 billion but beat Wall Street’s estimates by 0.8%.
ALSO WORTH WATCHING: Nvidia’s Quiet Partner. Nvidia’s chips cost a hundred grand. The connectors that make them work cost even more. One company makes them all.
Every AI server needs specialized infrastructure the chip companies don’t make. High-speed cables. Power connectors. Thermal sensors. This 90-year-old company built a monopoly on it. The AI boom just started. This stock is still flying under the radar. Claim The Stock Ticker Here for FREE.
Adjusted EBITDA margin
Weatherford was profitable over the last five years but held back by its large cost base. Its average EBITDA margin of 21.4% was weak for an upstream and integrated energy business.
On the plus side, Weatherford’s EBITDA margin rose by 3 percentage points over the last year.
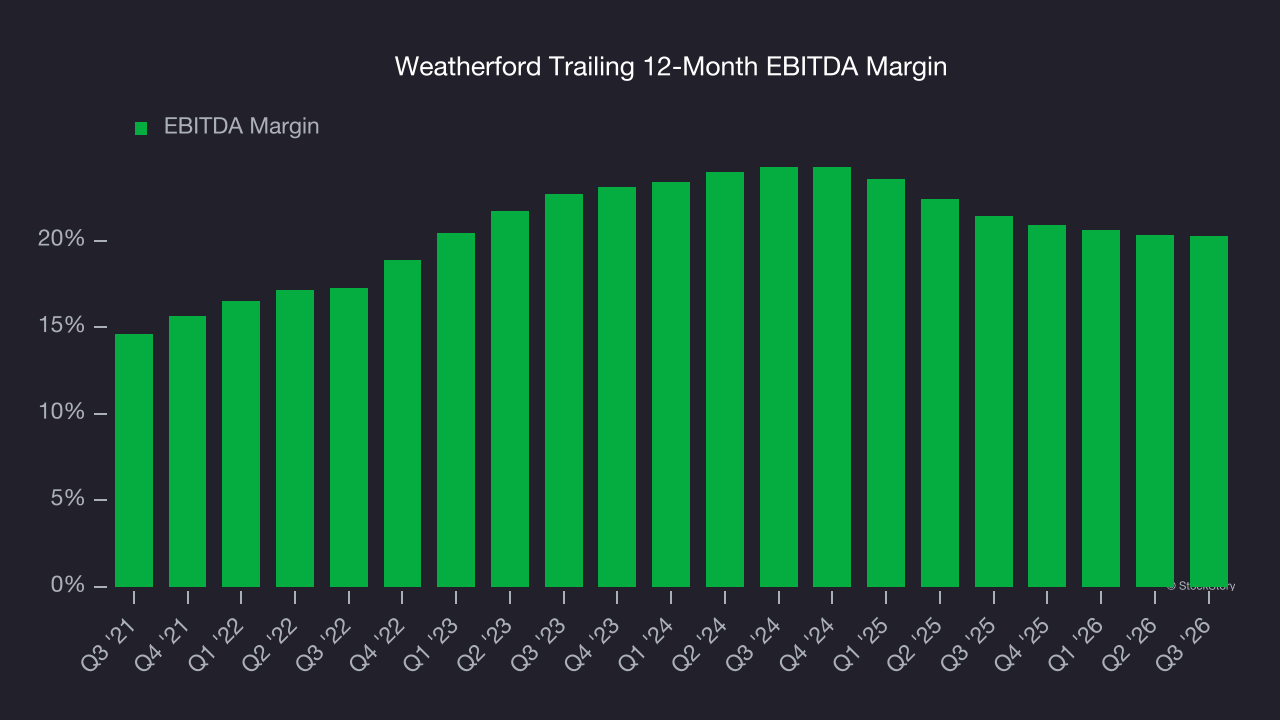
In Q3, Weatherford generated an EBITDA margin profit margin of 20.9%, in line with the same quarter last year. This indicates the company’s overall cost structure has been relatively stable.
Cash is king
As mentioned above, adjusted EBITDA ignores capital structure and drilling expenditure decisions. These are two huge aspects of an Energy producer, so in order to understand a comprehensive picture of business quality, an investor needs to account for these. Said differently, adjusted EBITDA margins could be solid but free cash flow is abysmal because decline rates of the asset are extreme and the drilling is expensive. Free cash flow tells you about not only the economics of the production that has happened but how much it costs to stay in business as well (further drilling or extraction).
Weatherford has shown decent cash profitability, giving it some flexibility to reinvest or return capital to investors. The company’s free cash flow margin averaged 9.8% over the last five years, slightly better than the broader energy upstream and integrated energy sector.
The level of free cash flow is important, but its durability across cycles is just as critical. Consistent margins are far more valuable than volatile swings driven by commodity prices.
Weatherford’s ratio of quarterly free cash flow volatility to WTI crude price volatility over the past five years was 4.6 (lower is better), indicating excellent insulation from commodity swings. This stability supports capital access in downturns and positions Weatherford to act as a consolidator when weaker peers are forced to retrench.
You may be asking why we wait until the free cash flow line to perform this stability analysis versus commodity prices. Why not compare revenue or EBITDA to WTI Crude prices in the case of Weatherford? Because what ultimately matters is not how much revenue or profit you earn when prices are high but how much cash you can generate when prices are low. Free cash flow is the superior metric because it includes everything from hedging prowess to growth and maintenance capex to management behavior during good times and bad.
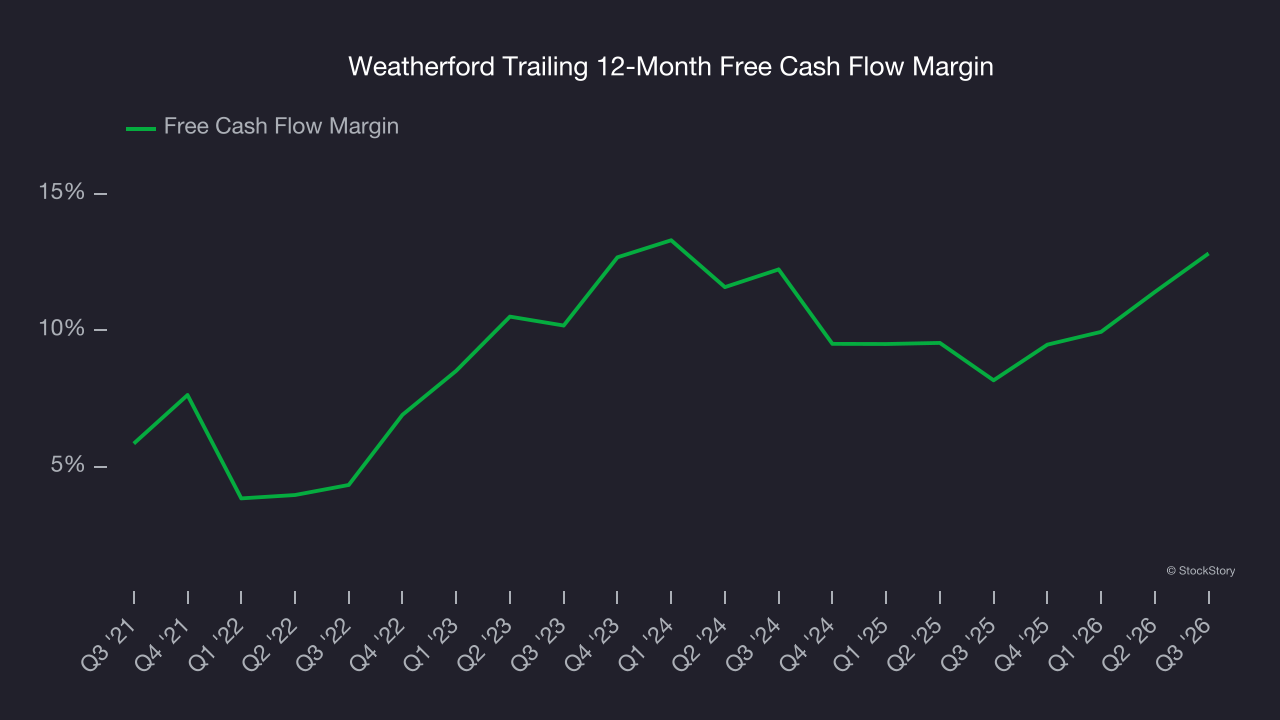
Weatherford’s free cash flow clocked in at $155 million in Q3, equivalent to a 13.6% margin. This result was good as its margin was 5.5 percentage points higher than in the same quarter last year, building on its favorable historical trend.
Key takeaways from Weatherford’s Q3 results
It was good to see Weatherford beat analysts’ EPS expectations this quarter. We were also happy its revenue narrowly outperformed Wall Street’s estimates. Zooming out, we think this was a decent quarter. The stock traded up 3.3% to $82.34 immediately following the results.
Should you buy the stock or not? The latest quarter does matter, but not nearly as much as longer-term fundamentals and valuation, when deciding if the stock is a buy. We cover that in our actionable full research report which you can read here (it’s free).