
- The Cash Silver Index has posted a high near $66.88 during December, up 131% for the year.
- With demand for green energy technology growing globally, except for the United States, silver supplies are expected to continue to tighten during 2026.
- Gold and copper could see mixed results next year, for much the same reason - intentionally created economic and political uncertainty.
Earlier this week, Monday morning if I recall, I was watching CNBC’s Squawk Box Europe to catch what the hot topics of the day might be in the US. Early in the program, the guest was John Meyer, Partner and Mining Analyst at SP Angel of London, was discussing the outlook for the Metals sector next year. Mr. Meyer mentioned how 2026 could be a “home run” for gold, silver, and copper for a variety of fundamental reasons. Starting with gold, the driver continues to be central bank buying, particularly from countries in the BRICS alliance (Brazil, Russia, India, China, South Africa, and their allies) in an ongoing attempt to move the world away from the US dollar. Mr. Meyer’s outlook for gold was north of $5,000, echoing my projection from back in October. His projection for silver was even more dramatic with a target of more than $70 as global demand from solar panels and electric vehicles could create a supply shortage. (And when I say global, I mean everywhere but the United States where “green” is a 4-letter word. Yes, I know, but that’s how things are these days.) However, we differ on our copper outlook, as you’ll see.
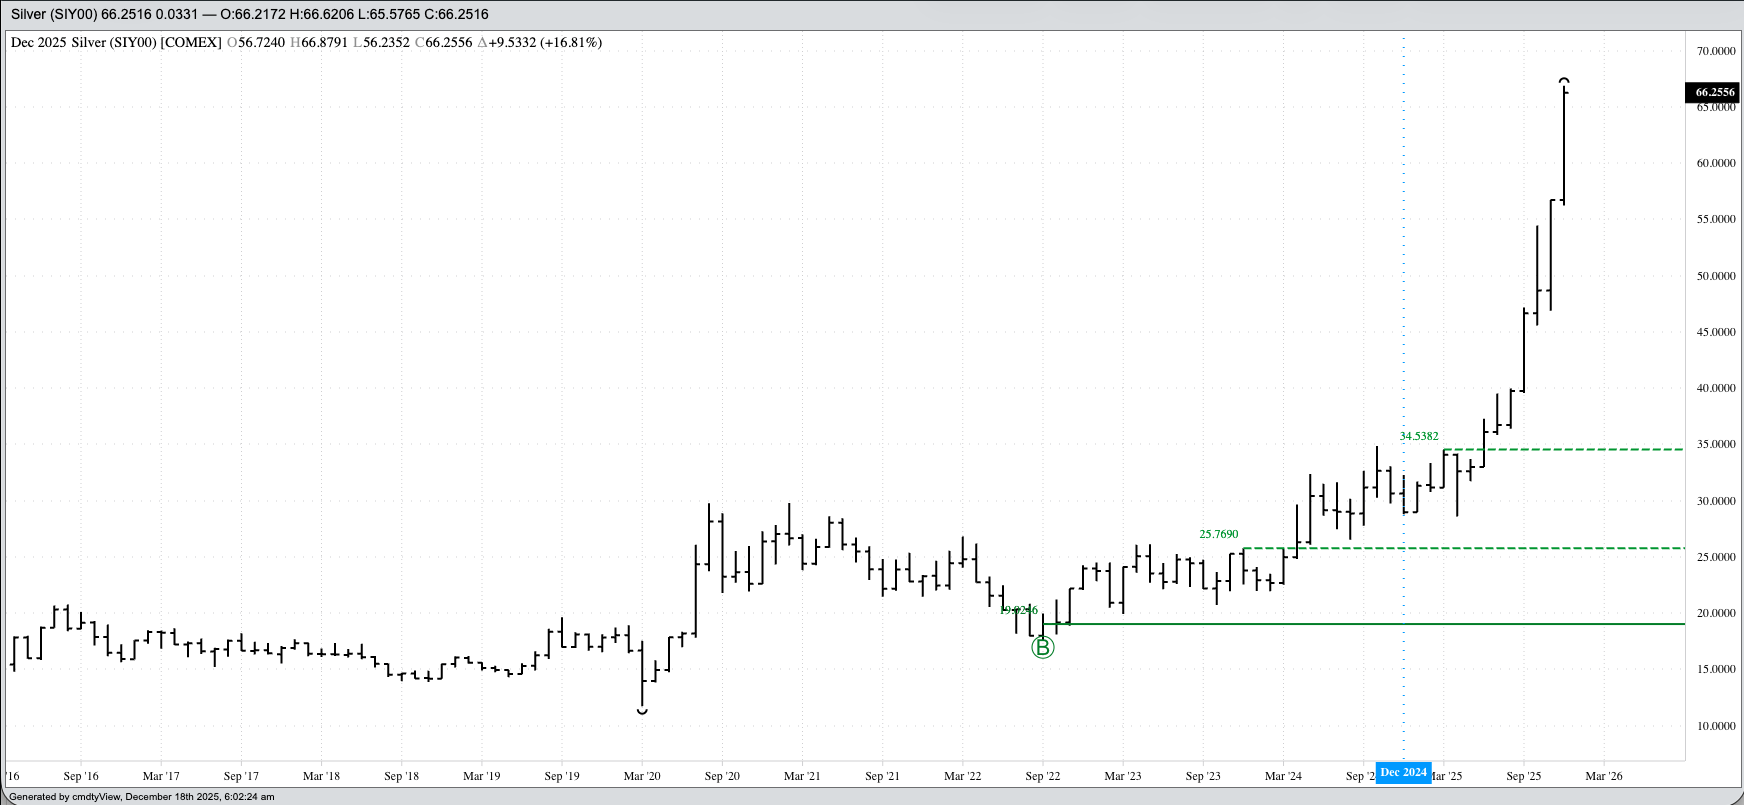
Let’s start with silver. The Cash Index (SIY00) has posted a high of $66.88 during December, so far. But as a friend in the brokerage industry likes to say, “There is a lot of month left the next two weeks.” Suddenly, $70 doesn’t seem so far away, with other analysts now talking about $100 being within reach based on something as simple as the Law of Supply and Demand. Back in August, I talked about how silver looked to be a demand-driven market, meaning the change in price range could be long-term. However, the rate the Index has rallied of late suggests there is a short supply squeeze taking place as well, though most likely not from the Hunt Brothers, meaning the market would be expected to fall back into a vacuum at some point. We just don’t know when or where. It’s interesting to note the silver/gold ratio that favored silver as an investment opportunity this past summer has since turned neutral. While not indicating long-term investors should get out of silver, it is telling us silver could lose some momentum versus gold over the coming weeks and months.
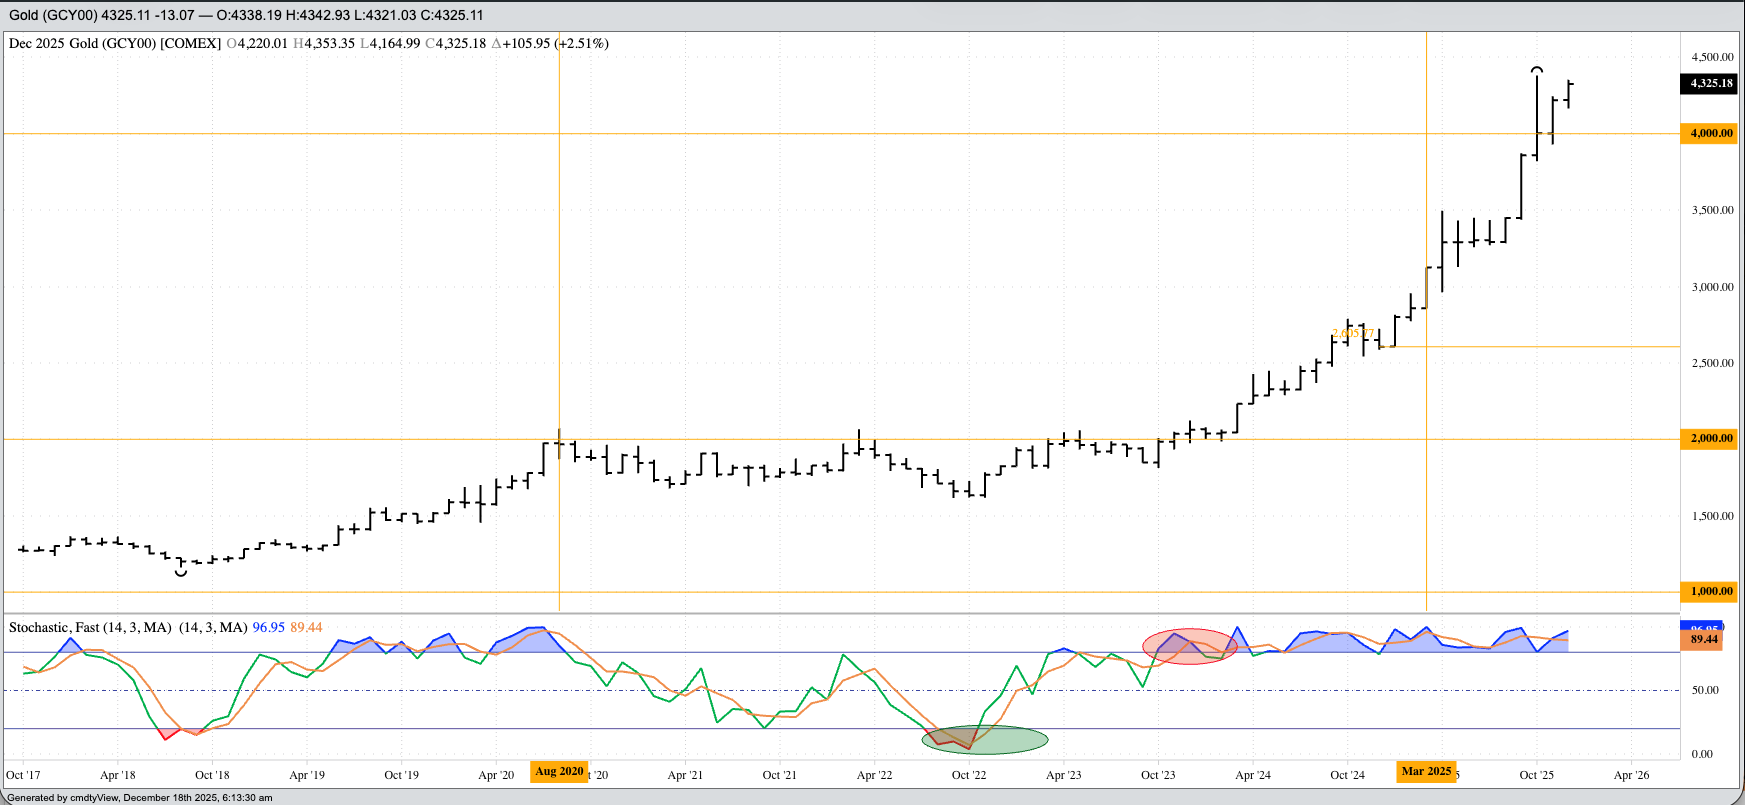
Speaking of gold, the Cash Index (GCY00) has recovered from its recent break, posting a December high of $4,353.35, just short of its all-time mark of $4,381.21 set during October. Recall at the time I talked about how the Index had flown through the $4,000 psychological barrier like a runaway train, though algorithms do not have a psyche, putting the spotlight on $5,000. And while my interpretation of the market’s Fibonacci sequence led to the conclusion the Index could hit the next big round number that same month, gold promptly ran out of bullish momentum short-term. The Index closed October priced at $4,002.85, still up $144.34 (3.7%) for the month and still above the big round number of $4,000. The last couple months have seen a steady, consistent climb as central banks around the world continue to buy. But they aren’t alone. Another point Mr. Meyer made is the strength in gold has been supplemented, but not drive, by investor buying. In my opinion, this is where the occasional sharp breaks come from as investor move money around, with the steady base of central bank buying providing support. Looking at the gold/copper ratio and we see the outlook for at least early 2026 continues to be one of economic concern (copper) and safe-haven buying (gold).
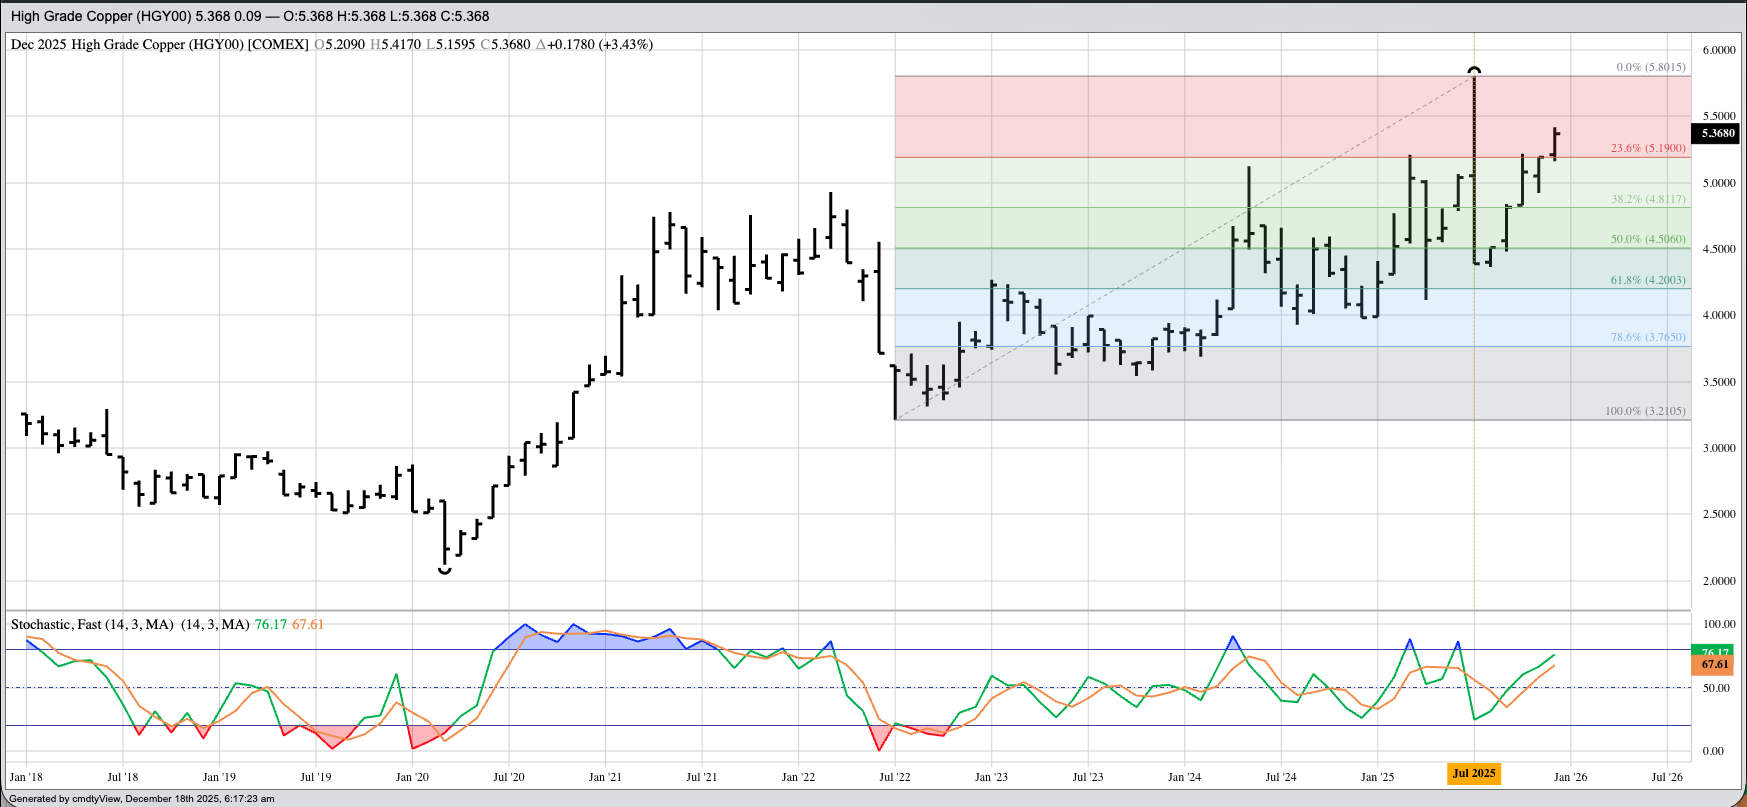
Which brings us to Dr. Copper, the economic indicator market. Here we see the Cash Index (HGY00) has firmed over the latter half of 2025, though remains well below its all-time high of $5.8015 set this past July. From a technical point of view it’s interesting to note the Index completed a bearish key reversal during July indicating the market’s long-term trend had turned down. As I talked about with Barchart’s Senior Market Strategist John Rowland last February, I don’t believe we can use technical patters as we have in the past since algorithms don’t have them built into their equations. Nevertheless, if we take the key reversal pattern at face value, and apply the first premise of technical analysis, “Market action discounts everything”, then the conclusion would be the copper market knew, and showed us, there is growing concern over global economics. If so, then this recovery rally by the Index could quickly collapse like a house of cards. This is the point on which Mr. Meyer and I disagree. He sees copper making a big move during 2026 where I see it as the sell side of position spreads with safe-haven gold and demand-driven silver.
On the date of publication, Darin Newsom did not have (either directly or indirectly) positions in any of the securities mentioned in this article. All information and data in this article is solely for informational purposes. For more information please view the Barchart Disclosure Policy here.
More news from Barchart